 How would you like to know how many people visit your website each month, what pages they look at, what city they are from and if they found you from Google, Facebook or from one of your vendor “find a dealer” pages?
Do you think knowing this type of information would help you allocate your marketing budget more effectively? You bet it would! How much would you be willing to pay each month to get this type of valuable information? How about $0. That’s right, say hello to the world of Google Analytics (GA).
Google Analytics is a free service provided by Google that can give you detailed statistics about your website’s traffic. If you don’t have Google Analytics installed on your website, stop what you’re doing right now and contact your webmaster and have them do it immediately. It will only take a few minutes and involves creating a Google Analytics account and installing a script on each page of your site that you want to track.
Once you’ve installed the script, you’ll need to wait about a month so that GA has enough time to gather some meaningful statistics to show you. I spend many hours each month analyzing GA stats for my pool and spa dealer clients, but for purposes of this article, I will be detailing just a few critical sections.
Audience – Overview Tab
After you login into your GA account, go to the Audience Overview page. By default, GA shows you the last 30 days of activity, but you can adjust the date range to view stats over a specific period of time.
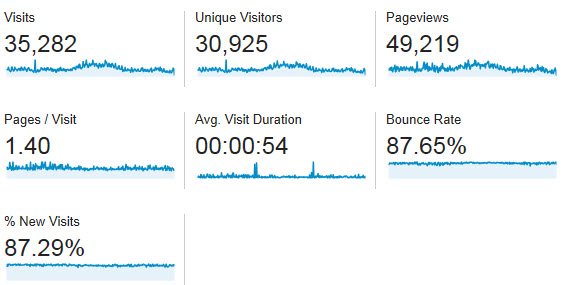
The audience overview provides you with the following information as defined by Google:
• Visits – total number of visits to your site
• Unique Visitors – total number of unique visitors to your site
• Page Views – total number of pages viewed on your site
• Pages per Visit – average number of pages viewed per visit
• Average Visit Duration – average visit length of all visitors
• Bounce Rate – percent of single-page visits
• New Visitors – percent of total visitors who visited your site for the first time

The audience overview is a good place to start, but to find the diamonds, you need to dig deeper. On the left side of GA, you’ll see a “table of contents” list of different information that you can view and analyze. Just click on the specific tab of interest.
Some of the more revealing tabs that can help you analyze and plan your marketing include: Cities, Traffic Sources, Mobile, and Goals.
 Geo Tab – Locations
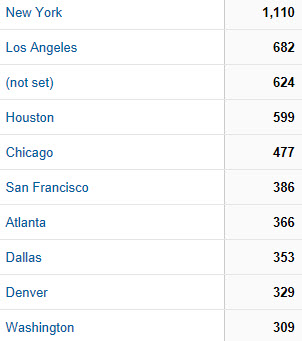
Want to know which cities in your area are brining you the most traffic? Then click on the Locations section found under GEO Tab. Then drill down until you reach the cities page.
Understanding where your traffic is coming from geographically can help you target specific cities with special advertising campaigns. Using the stats you see today as a benchmark, you can create a marketing campaign for a specific city then review the stats again in a few months to see if your traffic has increased to those targeted areas.
Acquisition Tab – All Traffic
Clicking the “All Traffic Tab” reveals your website traffic sources or how visitors are finding your site. This can include such things as search engines like Google, Bing or other websites.
This section also tells you if they just typed in your URL into their browser address bar – this is referred to as direct. This probably means they already know who you are or may have visited your site in the past.
Audience – Mobile
 Have you put off creating a mobile version of your website because you didn’t see the need? Clicking on the mobile tab will reveal how many people have visited your site from a mobile device like an iPhone or iPad.
Still Not convinced? Your can change the settings on GA and compare mobile traffic from year to year. If you see changes like you see here, then it’s time to create a mobile version of your website.
Behavior Tab – Site Content
Under this section you will see which pages on your website are visited most often. Understanding the implications from this information might help you add or delete content from specific pages or adjust the navigation tabs on your site to make it easier for visitors to find specific pages buried within a drop down menu.
Conversions Tab
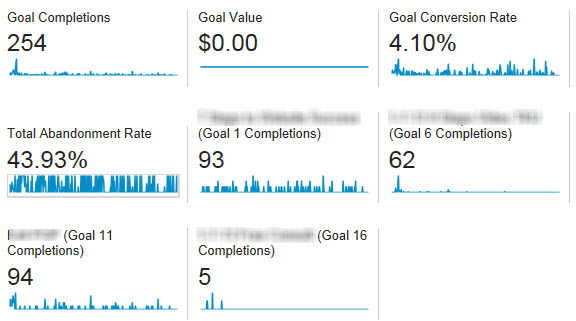
According to Google “a conversion is the completion of an activity on your site that is important to the success of your business. For example:
• a completed sign up for your email newsletter (a Goal conversion)
• a purchase (a transaction, sometimes called an Ecommerce conversion)
 You must define goals in Google Analytics in order to track goal conversions. You’ll be able to see the conversion rates and number of completions for each goal you set up.
This section is important if you are trying to convert a website visitor into a lead using different strategies on your website. You can create a goal for each strategy and then compare them to see which method is working better.
I could go on and on about the virtues of using Google Analytics. Suffice it to say that if you agree with the old saying “If it can be measured it can be improved,” then using Google Analytics to help grow your business is a good place to start.
David Carleton is a Local Business Marketing Consultant who specializes in showing owners how to spend less and get more from their marketing and advertising using low cost strategies in local business marketing, lead generation and conversion, Internet marketing and social media. To learn more go to http://LocalBusinessMarketingSuccess.com or call 858-442-3131


